Next: Kurt3D
Up: KURT2
Previous: KURT2
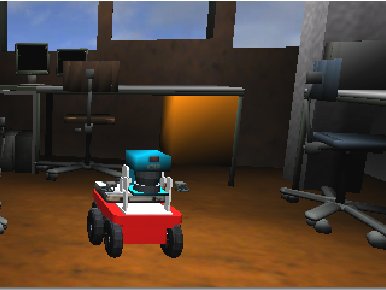
For the simulation of the robot, a model of the hardware as well
as a control software are needed. For the model, a mesh of the
robot has to be generated, which is done using the Unreal
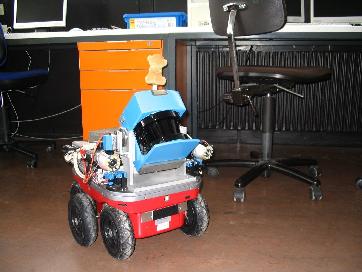
editor and Blender. Fig. 3 (right) shows the real and
the simulated robot.
As for the control software, we extended the exiting software for
the real robots with interfaces to access either the actual
hardware or the corresponding components of the simulation
software. This way, only small changes to the software were
necessary, and any future improvements are beneficial for both
applications, real world and simulated. The following code
fragment shows an example of retrieving laser range data, either
from a real SICK scanner or its simulated counterpart.
#ifdef USARSIM
   res = sim_client.SICK_read(fd_RS422,
                              buf, 255);
#else
   res = read(fd_RS422, buf, 1);
#endif
Currently the following components are simulated:
- A motor that drives the robot. Pulse width modulated signals
are simulated.
- Odometry determining wheel revolutions in ticks.
- A laser scanner yielding 181 distance values of one slice of the
environment in front of the robot.
- A gyro that estimates the current heading of the robot.
- A camera that provides images of the environment.
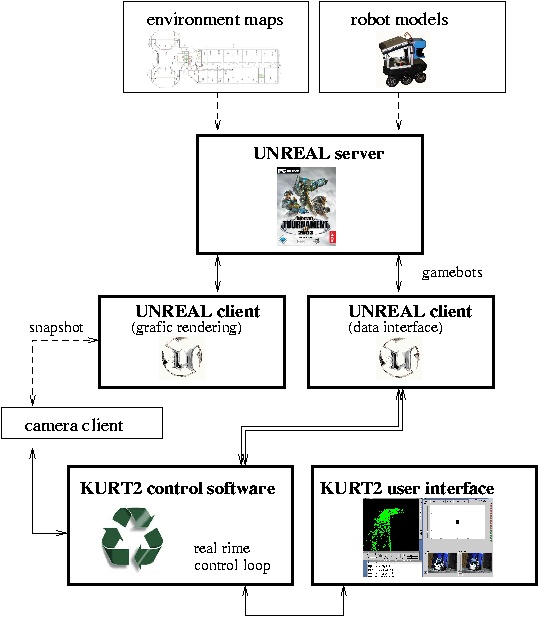
The camera device drivers are fed from a camera server, that in
turn is fed by a snapshot of an Unreal spectator
client. Fig. 5 (left) sketches the software
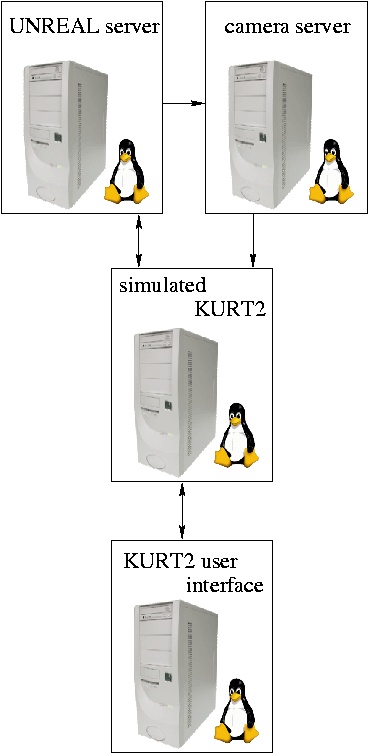
structure and the data flow. For fast simulation four computers
form a cluster:
- One computer is needed as Unreal server. The server
simulates all robot sensors, except cameras.
- The cameras are simulated on a second computer, running a small
program that captures pictures from an Unreal spectator
window.
- The control loop of the KURT2 robot runs on a third computer,
instead of the robot's notebook. Usually, the loop retrieves
motor signals with 100 Hz and laser range scans with 75 Hz.
- The user interface for driving the robot runs again on a
separate computer. This computer is connected to the previous
one, i.e., to the computer running the robot control
loop. There are no direct connections to Unreal.
The right part of Fig. 5 shows the 4-PC simulation
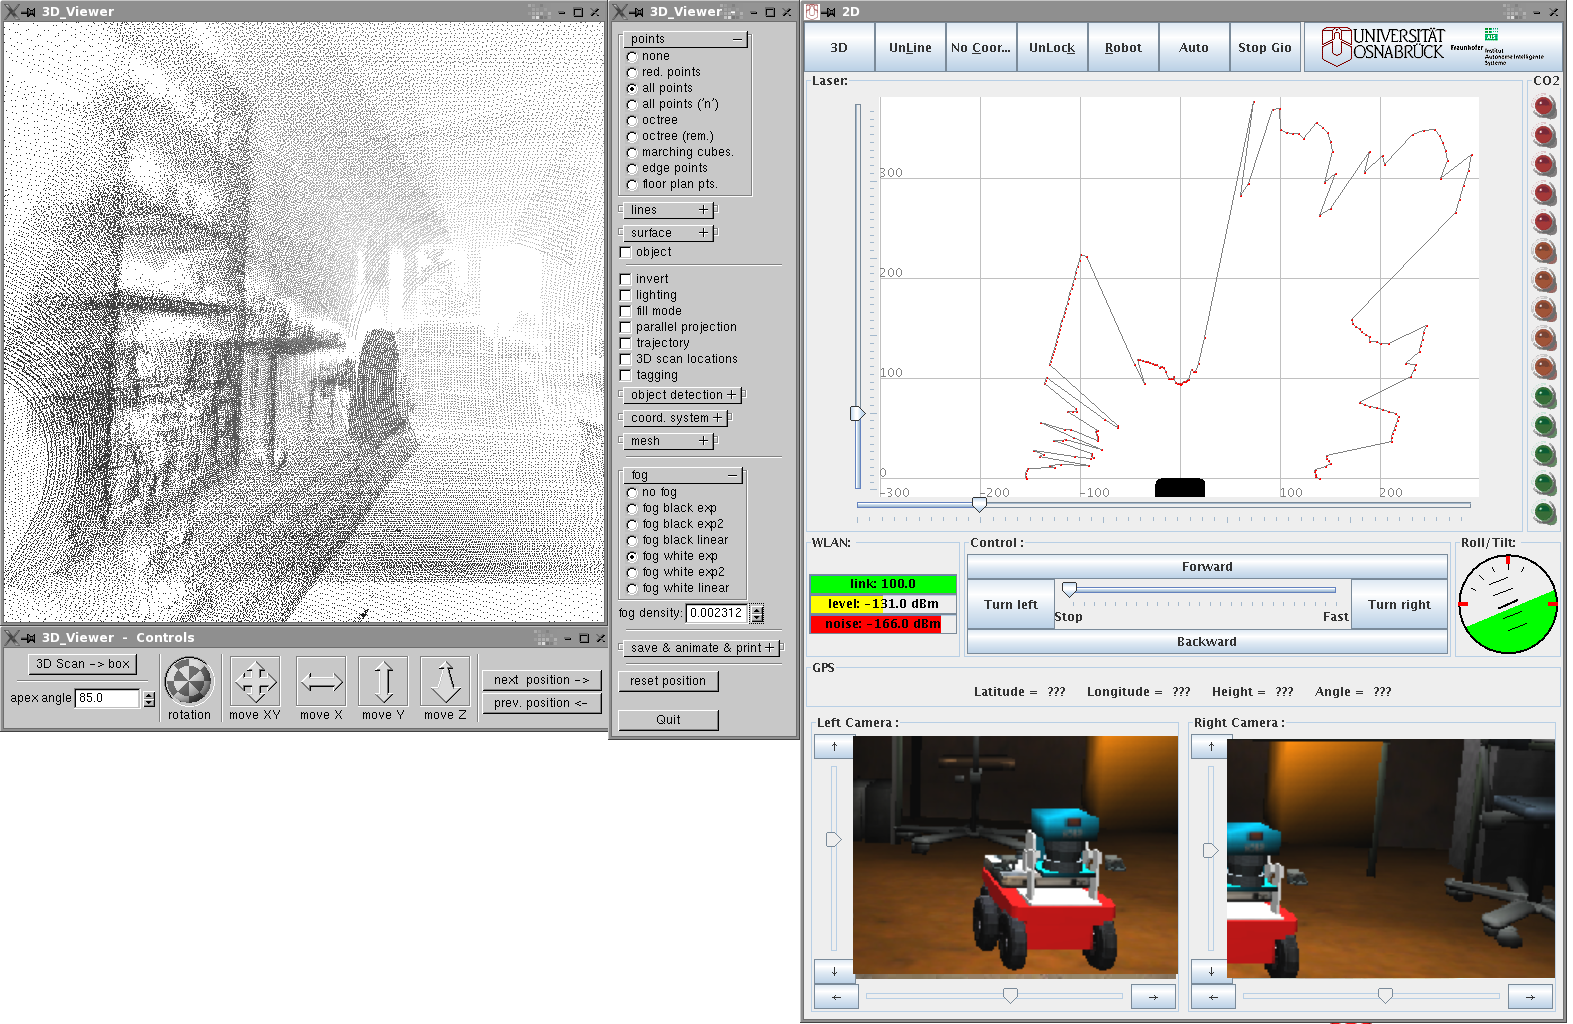
of KURT2. Fig. 6 shows the user interface of
KURT2. The shown data is transmitted from the control loop of the
robot.
Figure 4:
Left: Real Kurt3D robot. Right: Simulated Kurt3D.
|
|
Figure 5:
Left: The software architecture for simulating KURT2
robots. The arrows show the data flow, lines represent TCP/IP
connections, double lines are created, when programs are linked
and dashed lines are generated, when data files are
read. Right: Four computers are necessary for a fast KURT2
simulation. The lines represent TCP/IP connections and the arrows
the data flow.
|
|
Figure 6:
The user interface for driving Kurt3D robots. The laser
range data and the camera data originates from simulation.
|
|
Next: Kurt3D
Up: KURT2
Previous: KURT2
root
2006-05-29