Institute for Autonomous intelligent Systems, Schloss Birlinghoven,
D-53754 Sankt Augustin, Germany, {surmann
VMV 2001, Stuttgart, 21 - 23 Nov. 2001
Hartmut Surmann, Kai Lingemann, Andreas Nüchter and Joachim Hertzberg
FhG AiS - Fraunhofer Gesellschaft
Institute for Autonomous
intelligent Systems,
Schloss Birlinghoven,
D-53754 Sankt Augustin, Germany,
{surmann![]() lingemann
lingemann![]() nuechter
nuechter![]() hertzberg}@ais.fraunhofer.de
hertzberg}@ais.fraunhofer.de
VMV 2001, Stuttgart, 21 - 23 Nov. 2001
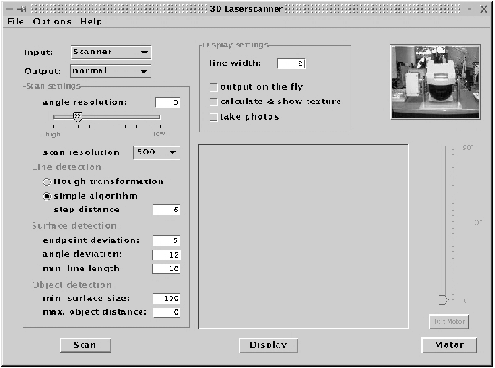
An important issue for man made environments is the choice of the sensor type from which raw range information from the scene is obtained. Today's commercial 3D laser range finders are large and heavy, build for stationary use mainly.
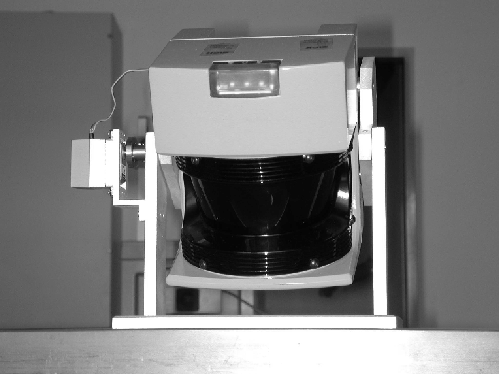
This paper presents a mobile 3D laser range
finder. (fig. 1). The scanner is built on the base of a
commercial 2D laser range finder from Schmersal together with a
special designed suspension unit and a standard servo
motor1 (1). The 2D scanner is very fast (processing
time ![]() 15 ms), precise (
15 ms), precise (![]() 1 cm,
1 cm, ![]() ) and becoming
cheaper (
) and becoming
cheaper (![]() $3000) since different competing products
e.g. 3 (3); 2 (2) are available.
$3000) since different competing products
e.g. 3 (3); 2 (2) are available.
A few number of scientific groups develop fast, lightweight and mobile
3D laser range finders and/or special algorithms on the basis of 2D
laser range finders to overcome the drawback of only 2D proximity
information 7 (7); 6 (6); 5 (5); 4 (4). Thrun et
al. use two laser range finders, one rotated by 90 degrees
5 (5). The 3D information is generated while the robot
is moving. The accuracy of the acquired data depends on the accuracy
of the robot pose. 3D-Object detection without moving the robot is not
possible. Waltheim et al. 7 (7) and Kristensen et
al. 6 (6) use an amtec rotation module
8 (8) with high accuracy at high costs (![]() $3500).
$3500).
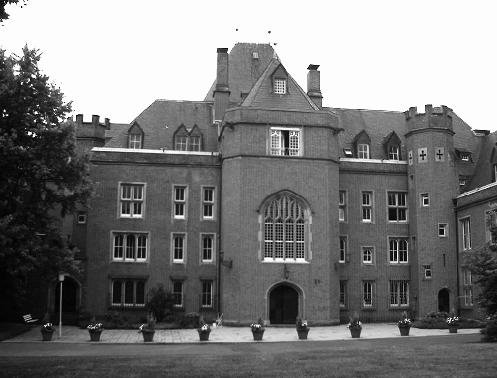
Due to the flexible setup we can connect different 2D laser range finders (Schmersal 3 (3), Sick 2 (2)). This leads to a wide variety of scan resolutions and scan speeds (see tab. 1) - the latter also depending on the used serial device. The used laser range finder (max. scanning distance 60m) can also be used outside of buildings (see fig.2).
| |||||||||||||||||||||||||||||||||||||||||||||
The given setup determines an intrinsic order of the acquired data. The data coming from the 2D laser range finder is ordered anticlockwise. In addition the 2D scans (scanned planes) are ordered due to the rotation.
The 3D laser range finder uses only standard computer interfaces. The servomotor is directly connected to the parallel port, the 2D laser range finder to the serial port and the camera is connected to an USB port. Nowadays, every computer (esp. laptops) does have these interfaces and therefore the built 3D laser range finder can be used easily on mobile platforms.
The mount and the servo are inexpensive and no special electronic devices are used, so the price of the whole system mainly depends on the used 2D laser range finder.
The servo of the new 3D laser range finder is controlled by a
computer running RT-Linux, a real-time operating system which runs
LINUX as a task with lowest priority. The servomotor expects a signal
every 20 ms, the length of the signal determines the position of the
motor (1 ms = leftmost position, 1.5 ms = middle position, 2 ms =
rightmost position). This very time critical job has to be done by a
real-time operating system, since a latency of about 10 ![]() s corresponds
to a deviation of
s corresponds
to a deviation of
![]() . Real-time Linux has an average latency of
about 5
. Real-time Linux has an average latency of
about 5 ![]() s (PII-333) and thus the rotation can be realized
with an average deviation of
s (PII-333) and thus the rotation can be realized
with an average deviation of ![]() .
.
While scanning, different online algorithms for line and surface detection (LENCOMP & HOUGH & LINMER) are applied to the data, thus no extra processing time is needed. Two different kinds of line detection algorithms have been tested 10 (10); 9 (9).
The first algorithm (LENCOMP) is a simple straightforward matching algorithm
running in ![]() (
(![]() the number of points), with small
constants. The algorithm implements a simple length comparison. The
data of the laser range finder (points
the number of points), with small
constants. The algorithm implements a simple length comparison. The
data of the laser range finder (points
![]() ) is ordered
anticlockwise so that one comparison per point is sufficient. We assume
that the points
) is ordered
anticlockwise so that one comparison per point is sufficient. We assume
that the points
![]() are already on a line. For
are already on a line. For
![]() we have to check if
we have to check if
 |
(1) |
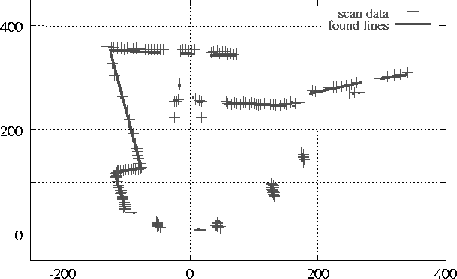
The second line detection algorithm implemented is the well known
Hough Transformation 12 (12); 11 (11) (see fig. 4). A
(![]() ) parameterization of the space of lines is used, where
) parameterization of the space of lines is used, where
![]() is the angle of the normal to the line and
is the angle of the normal to the line and ![]() the
distance along this normal from the line to the origin of the image. A
transformation of every point
the
distance along this normal from the line to the origin of the image. A
transformation of every point ![]() results in a histogram. The
maximum of the histogram corresponds to a line and the number of
points belonging to this line is maximal.
results in a histogram. The
maximum of the histogram corresponds to a line and the number of
points belonging to this line is maximal.
The iteration of the following three steps returns all line segments.
The Hough-Transformation runs in ![]() ), with
), with ![]() the
distance to the furthest data point. This maximum distance is currently
limited to 10 m, so that the transformation can be done in real-time. For
indoor environments this limitation is sufficient.
the
distance to the furthest data point. This maximum distance is currently
limited to 10 m, so that the transformation can be done in real-time. For
indoor environments this limitation is sufficient.
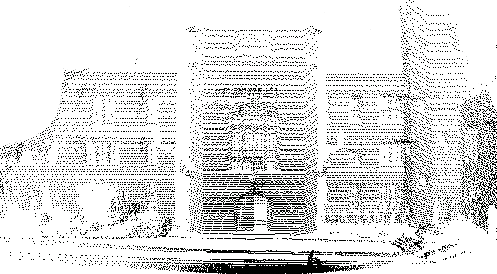
After line detection the transformation of the 2D coordinates into 3D coordinates is done (fig. 5). All following data processing steps operate on the three dimensional data.
Scanning a plane surface, the line detection algorithm returns a sequence of lines in successive 2D scans approximate the shape of this surface. Now, the task is to recognize such structures within the 3D data input and to concatenate these independent lines to one single surface. The surface detection algorithm LINMER proceeds the following steps:
To achieve real time capabilities, the algorithm makes use of the characteristics of the data as it comes from the range finder, i.e. it is the order by the scanned planes. Therefore the lines are sorted throughout the whole scene (with regard to their location within the virtual scene) due to their inherited order. Thus an efficient local search can be realized.
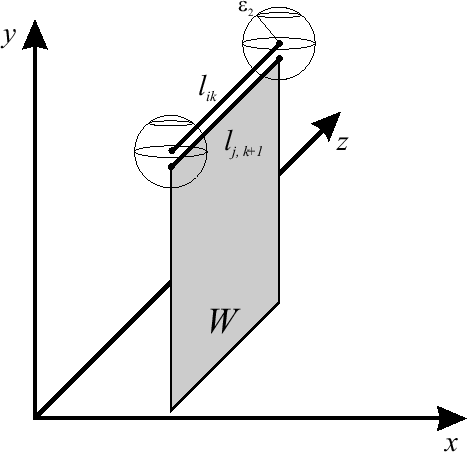
Three criteria have to be fulfilled in order to match lines: First the
angle between the two lines has to be smaller than a given value
![]() . Second the endpoints of the matching line must be within an
. Second the endpoints of the matching line must be within an
![]() -area around the corresponding points of the given line
(fig. 6). The first constraint is necessary for correct
classification of short lines, since they fulfill the distance
criterion very easily. To match a line with a surface these two
constraints have to hold between the last line of the surface an the
new line taken into account. In addition we apply a third constraint
that is the line has to lie approximately in the plane given by the
surface.
-area around the corresponding points of the given line
(fig. 6). The first constraint is necessary for correct
classification of short lines, since they fulfill the distance
criterion very easily. To match a line with a surface these two
constraints have to hold between the last line of the surface an the
new line taken into account. In addition we apply a third constraint
that is the line has to lie approximately in the plane given by the
surface.
This step, merely a joining of lines found in former scans, can be done online, too, since no data from future scans is necessary. This means that the robot or a user gets much 3D information about objects in the scenery right during the scan.
The surface detection routines creates surfaces consisting
of lines. Since the quality of the lines is limited due to noise of
the scan data, the result of the surface detection are small surfaces
which may even overlap. The task of polygon creation is to merge
these surfaces to polygons.
Polygon detection is divided into three steps:
Each polygon can be a single polygon or a polygon set. Each individual polygon in a polygon set may be convex, concave of self-intersecting. Clipping is defined as interaction of the so called subject polygon and the clipping polygon, hence it is also usable for 2D Boolean operations, e.g. union. If two polygons are approximately within the same plane, these polygons at a time are clipped.
The polygons are striped from bottom to top. Each strip is a horizontal (with respect to the 2D polygon coordinate system) sweep, that is an area between two successive horizontal lines from a set of horizontal lines drawn through all the vertices. During the striping the local maxima and minima are determined, vertices and intersections are classified. From this classification Vattis algorithms computes in our case the overall polygons.
Vattis algorithm runs in linear time in the number of edges of the subject and clipping polygon. The polygon merging algorithm is also used to merge polygons from different scans resulting in a complete surface model of the environment.
As a final step the generated polygons (convex or concave) are transformed into triangle strips only to visualize them in OPENGL.
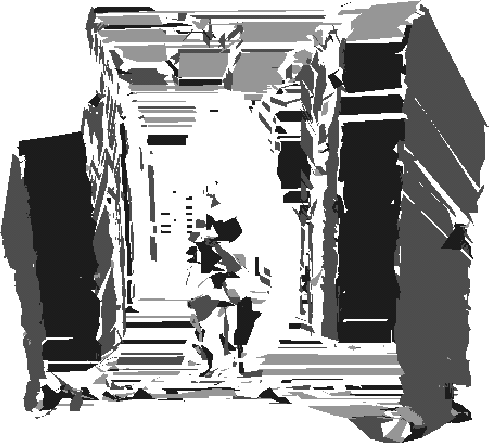
Figure 7 shows the result of the polygon merging step applied to the scan shown in figure 5
3D-Object segmentation (O-SEG) is done by sequentially merging conglomerations of 3D-points, 3D-lines and 3D-surfaces into one 3D-object:
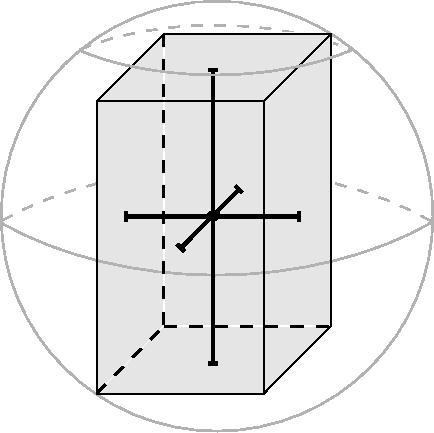
The objects are characterized by bounding boxes (cubes) (fig. 8). A bounding box is given by 3 orthogonal lines, corresponding to the axes of the virtual world coordinate system. In addition, each object is surrounded by a sphere which encloses the whole bounding box. This sphere is used to check very fast whether a single point is near enough to this object to be examined as part of the bounding box.
The O-SEG algorithm first checks if the point is inside the sphere. This can be done by testing the euclidian distance. If the element passes this test, the algorithm determines whether the point is near enough to the actual bounding box. In this case, the lines defining the bounding box have to be re-adjusted to enclose this new point, the sphere likewise.
This procedure can be generalized to handle other kinds of elements as well, since lines are represented by 2 points and surfaces by 2 lines.
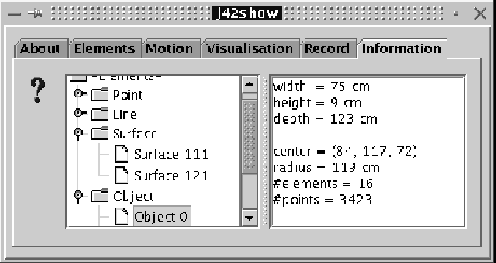
To visualize the data, a viewer program 2SHOW based on OPENGL was implemented. The task of this program is the projection of the 3D scene to the image plane, i.e. the monitor. A graphical user interface J42SHOW (fig. 9) developed with JAVA enables a simple and easy way to use the scanner application.
The viewer program can easily be controlled by an extern JAVA panel (fig. 10 & 11). It enables the user to select the element types that are drawn (points, lines, surfaces and objects), to navigate through the 3D scene, to use a simple VCR interface and to extract further information about the scene: clicking on an element returns position, size and - depending on the type of the element - data like number of points within the object, etc.
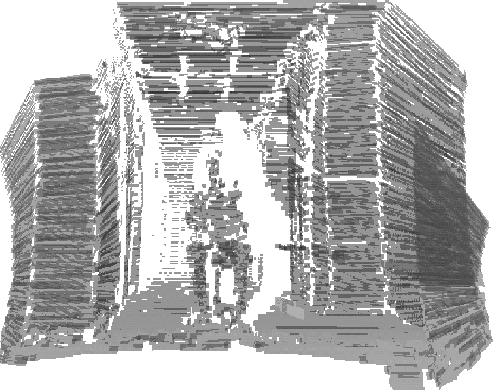
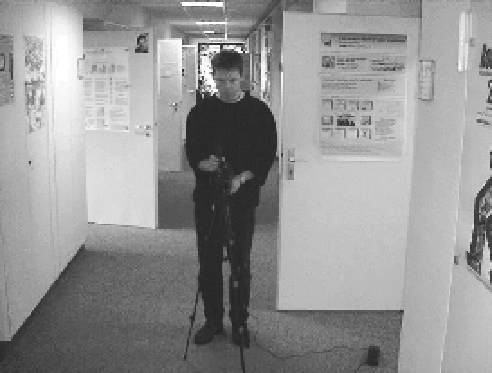
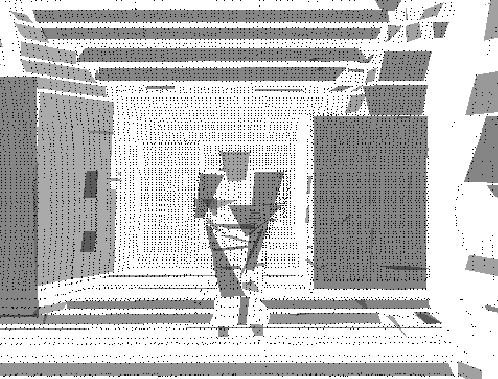
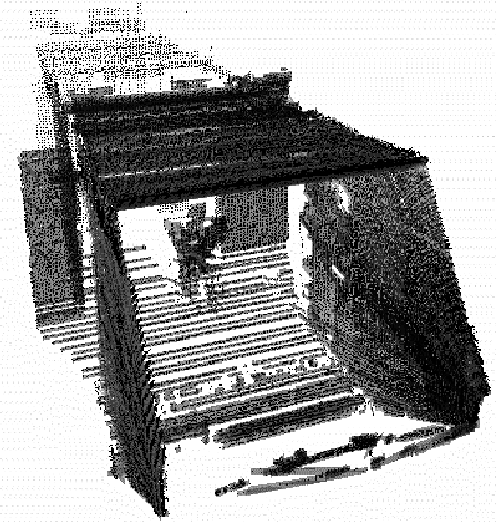
An example (fig. 13 & 14)
visualizes the performance of the
scanner and the implemented algorithms. It shows the 2nd author taking
a video in a corridor and two different views of the scanned
scene.
The scene was scanned in 12 seconds (schmersal scanner). During the 12 seconds
the 115000 data points were reduced to 2596 lines and 977 surfaces.
The door on the right side as well as some parts of the walls are
detected as flat surfaces![[*]](foot_motif.gif) .
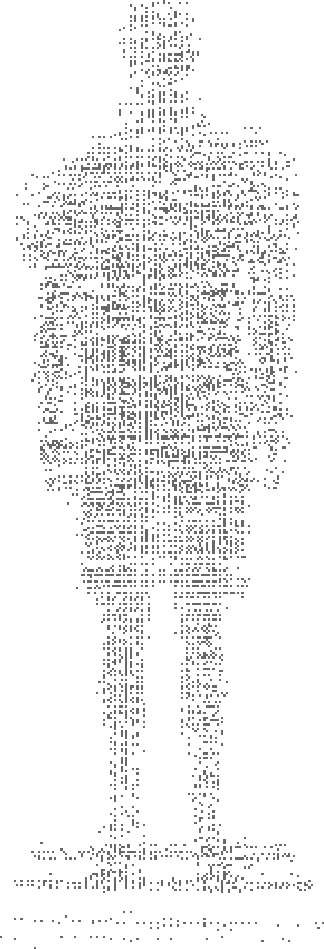
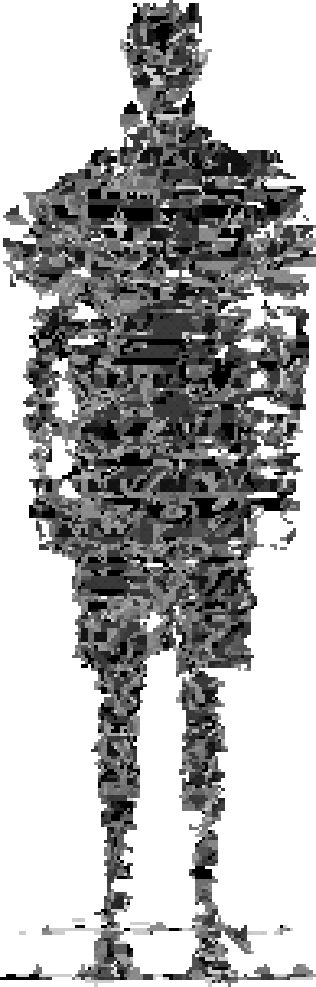
Another interesting application is the use of the 3D laser range finder as
a body scanner (fig. 12).
.
Another interesting application is the use of the 3D laser range finder as
a body scanner (fig. 12).
After the scanning process, 180 polygons are created containing only 1144 data points. In addition 60 objects are detected in 2.5 seconds.
Several products and applications benefits from our 3D laser range finder because it is light, small and very fast:
Acknowledgment Special thanks to Stefan Materne and the unknown reviewers for hints and corrections.