Next: Conclusions
Up: Results
Previous: Simulation Performance
We have tested our 3D environment mapping system [4]
in the simulated AVZ building and in the USARSIM yellow arena as
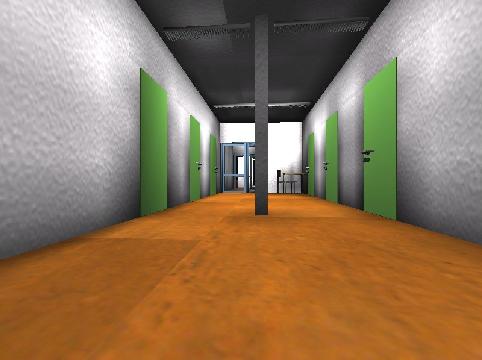
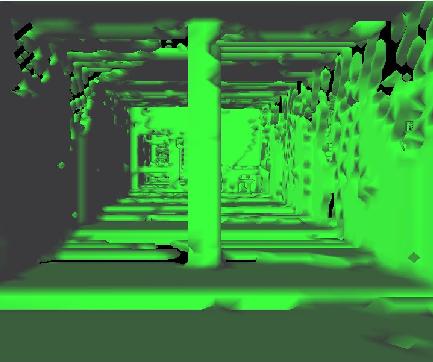
provided by NIST. Fig 7 shows images of the arena
vs. simulated depth data. Fig. 9. presents the result
of an octree representation (top right) and a marching cubes
algorithm (bottom right) that extracts 3D meshes reliably from
the data points and vectorizes the data.
Figure 7:
Left: Rendered images from the AVZ building. Right: Simulated 3D scan.
|
|
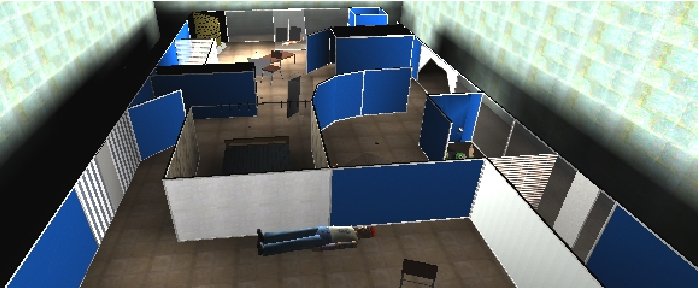
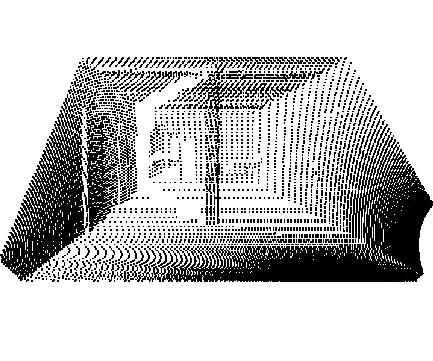
Figure 8:
Left: Unreal map of the AVZ building (top) and of
the yellow arena (bottom). Right: Corresponding marching cube
representation (top) and point cloud in a bird eyes view (bottom).
|
|
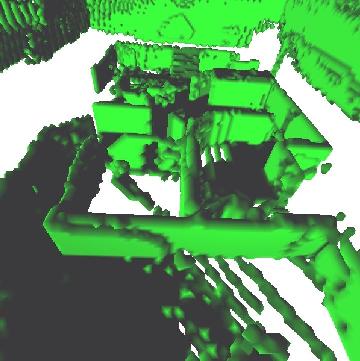
Figure 9:
Marching cube mesh of the yellow arena
|
|
Next: Conclusions
Up: Results
Previous: Simulation Performance
root
2006-05-29