|
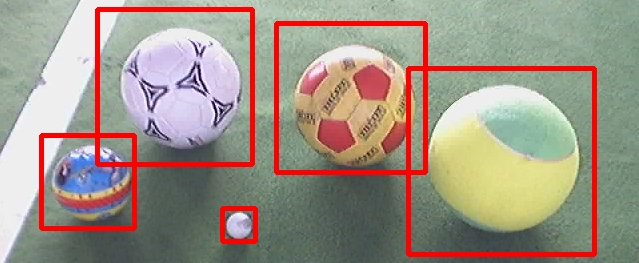
For each kind of ball we ran the test with 60 images, making a total of 180 test images. The results in Table I reveal how many red, white or yellow/red balls were correctly classified or not detected, as well as the number of false positives for each ball. The problems we were facing with this approach was the difficulty to differentiate between soccer balls and other spherical objects (Fig. 7).
| # stages | Correct | Not Detected | False Pos. | |
| red ball | 52/60 | 8/60 | 114 | |
| white ball | 9 | 48/60 | 12/60 | 70 |
| yel/red ball | 57/60 | 3/60 | 108 | |
| Total | 157/180 | 23/180 | 292 | |
| red ball | 45/60 | 15/60 | 52 | |
|---|---|---|---|---|
| white ball | 10 | 44/60 | 16/60 | 45 |
| yel/red ball | 57/60 | 3/60 | 63 | |
| Total | 146/180 | 34/180 | 160 | |
| red ball | 45/60 | 15/60 | 51 | |
| white ball | 11 | 42/60 | 18/60 | 47 |
| yel/red ball | 56/60 | 4/60 | 65 | |
| Total | 143/180 | 37/180 | 163 | |
| red ball | 44/60 | 16/60 | 26 | |
| white ball | 12 | 29/60 | 31/60 | 31 |
| yel/red ball | 37/60 | 23/60 | 23 | |
| Total | 110/180 | 70/180 | 80 |
The detection rate of the classifier is adjustable, i.e., a lower number of stages of the cascade increases the number of detections (hits), but also the amount of false detections. By combining the classifier and the attention algorithm the false positive detection rate will be reduced.