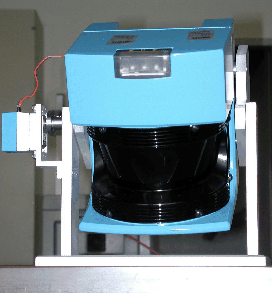
The AIS 3D laser range finder (figure 1) [19] is built on the basis of a 2D range finder by extension with a mount and a servomotor. The 2D laser range finder is attached to the mount for chieving a controlled pitch motion. A standard servo is connected on the left side (figure 1) and is controlled by the computer running RT-Linux, a real-time operating system which runs LINUX as a task with lowest priority [19,20]. The 3D laser scanner operates up to 5h (Scanner: 17 W, 20 NiMH cells with a capacity of 4500 mAh, Servo: 0.85 W, 4.5 V with batteries of 4500 mAh).
The area of
![]() (h)
(h)![]() (v)
is scanned with different horizontal (181, 361, 721) and vertical
(128, 256) resolutions. A plane with 181 data points is scanned
in 13 ms by the 2D laser range finder (rotating mirror
device). Planes with more data points, e.g., 361, 721, duplicate
or quadruplicate this time. Thus a scan with 181
(v)
is scanned with different horizontal (181, 361, 721) and vertical
(128, 256) resolutions. A plane with 181 data points is scanned
in 13 ms by the 2D laser range finder (rotating mirror
device). Planes with more data points, e.g., 361, 721, duplicate
or quadruplicate this time. Thus a scan with 181 ![]() 256
data points needs 3.4 seconds. In addition to the distance
measurement the 3D laser range finder is capable of quantifying
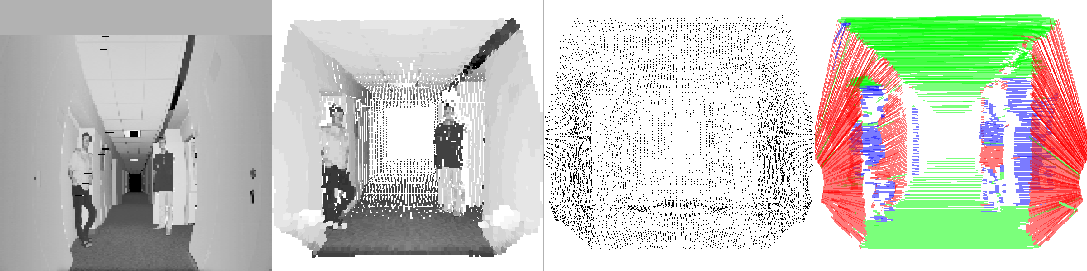
the amount of light returning to the scanner. Figure 2
(top row) shows an example of a reflectance image of the
GMD-Robobench, a standard office environment for the evaluation
of autonomous robots. The left image gives an distorted view of
the scene: One scan line of the figure corresponds to a slice of
the 2D scanner, the rotation of the scanner is not
considered. The right image shows the scene with the distortions
corrected.
256
data points needs 3.4 seconds. In addition to the distance
measurement the 3D laser range finder is capable of quantifying
the amount of light returning to the scanner. Figure 2
(top row) shows an example of a reflectance image of the
GMD-Robobench, a standard office environment for the evaluation
of autonomous robots. The left image gives an distorted view of
the scene: One scan line of the figure corresponds to a slice of
the 2D scanner, the rotation of the scanner is not
considered. The right image shows the scene with the distortions
corrected.
 |
The scanner emits the laser beams in a spherical way, such that the data points close to the source are more dense. The first step is to reduce the data. Therefore, data points located close together are joined into one point. The number of these reduced points is one order of magnitude smaller than before (figure 6 (right)). Furthermore noise within the data is reduced [20].
Second a simple length comparison is used as a line detection
algorithm. Given that the anticlockwise ordered data of the laser
range finder (points
![]() ) are located on a
line, then for
) are located on a
line, then for ![]() the algorithm has to check if
the algorithm has to check if
![]() to determine if
to determine if ![]() is on line with
is on line with ![]() .
.